Student Achievement
Student Achievement Indicators
State College of Florida, Manatee-Sarasota (SCF) uses six primary indicators for the measurement of student achievement. These six items, listed below, were chosen because they provide feedback on student success along the educational journey at SCF.
- Average Transfer Student GPA
- Total 6-Year Graduation Rate (National Student Clearinghouse)
- Degrees/Certificates Awarded
- Course Completions per Attempt
- Persistence Rate
- Licensure Exam Passing Rate
From the success rate at the individual course level, persistence from Fall term to Spring Term, to graduation rate and even post-graduation licensure rate SCF carefully monitors student progress.
In addition to these measures, SCF also established a threshold value to ensure that changes in a negative direction are addressed, The threshold for each of these values is set at 95% of the 5 -year rolling average for each category. In addition, action is also taken if a value has a continuous decline over the 5-year period even if the value does not fall below the threshold. The data for the most recent 5-year period are provided below.
2023 Student Achievement Measures
SCF Performance Dashboard Figures 2023
| 2018-19 | 2019-20 | 2020-21 | 2020-21 | 2022-23 | Threshold | |
|---|---|---|---|---|---|---|
| Average Transfer Student GPA1 | 3.13 | 3.19 | 3.22 | 3.20 | 3.26 | 3.04 |
| Total Graduation Rate2 | 38.6% | 40.9% | 36.3% | 42.8% | 42.4% | 38.2% |
| Degrees/Certificates Awarded3 | 1,859 | 1,839 | 2,608 | 2,227 | 1,885 | 1,976 |
| Course Completions per Attempt4 | 82.2% | 81.0% | 80.1% | 80.4% | 80.5% | 76.8% |
| Persistence Rate5 | 78.4% | 78.55% | 77.6 % | 78.7% | 78.4% | 74.4% |
| License Exam Passing Rate6 | 95.8% | 98.4% | 91.3% | 93.3% | 92.3% | 89.5% |
Disaggregated Graduation Rates
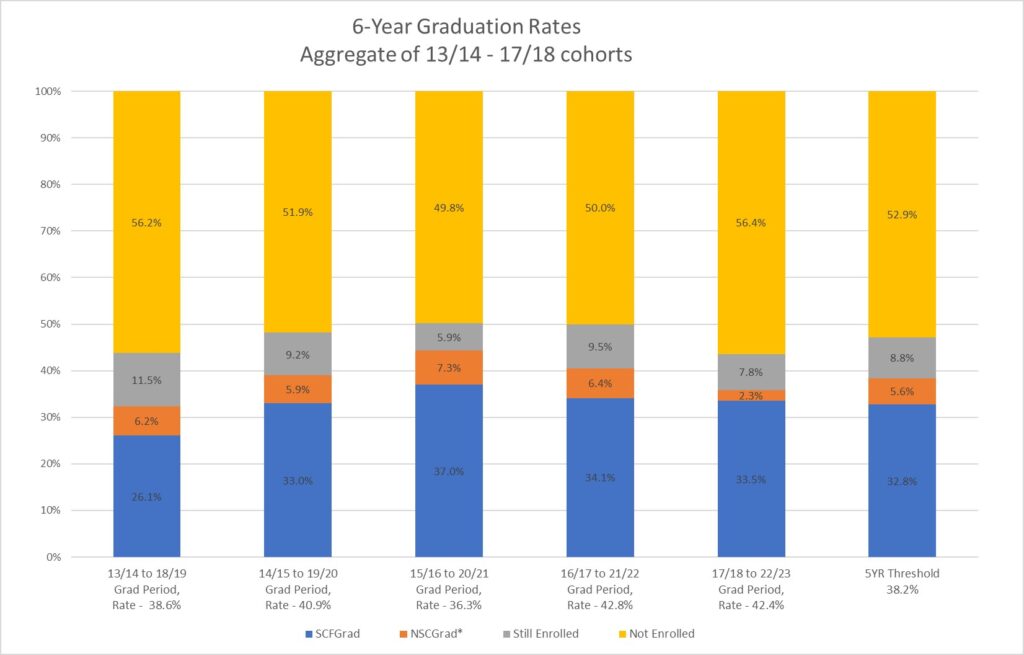
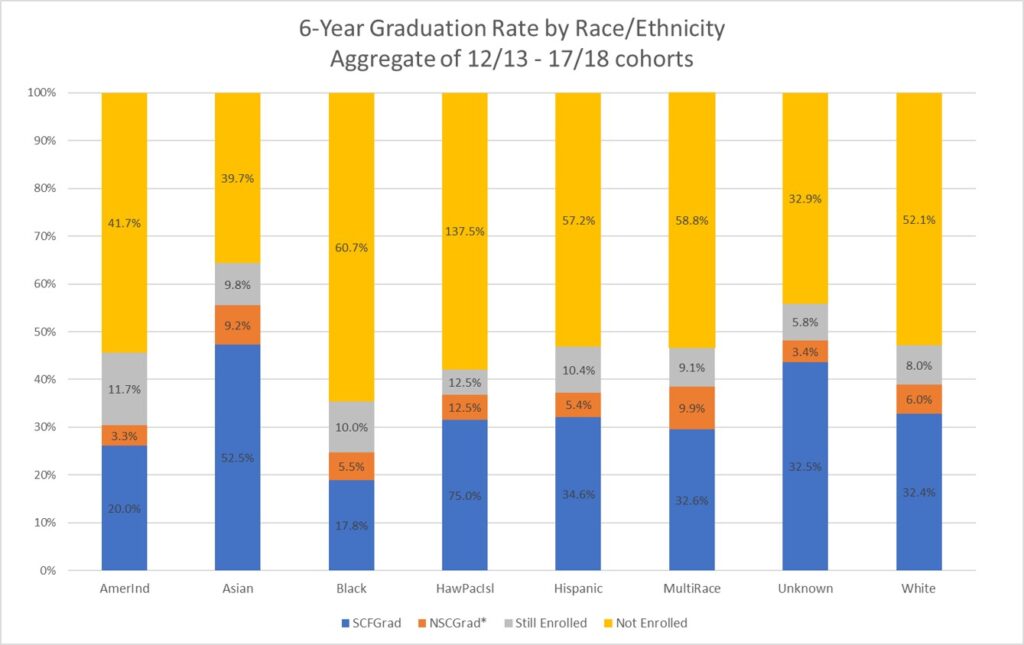
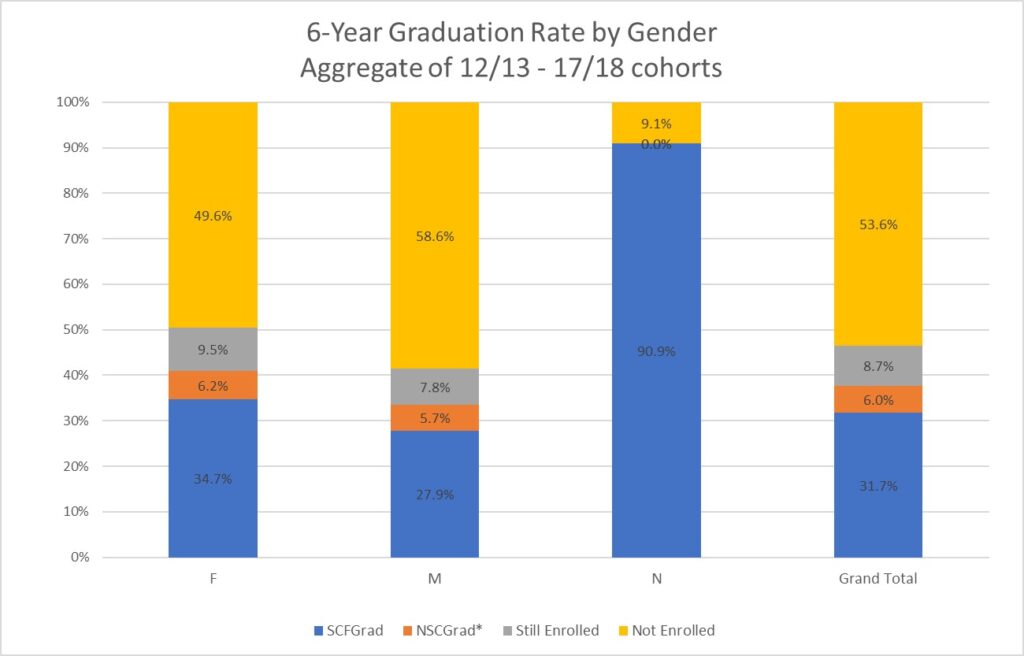
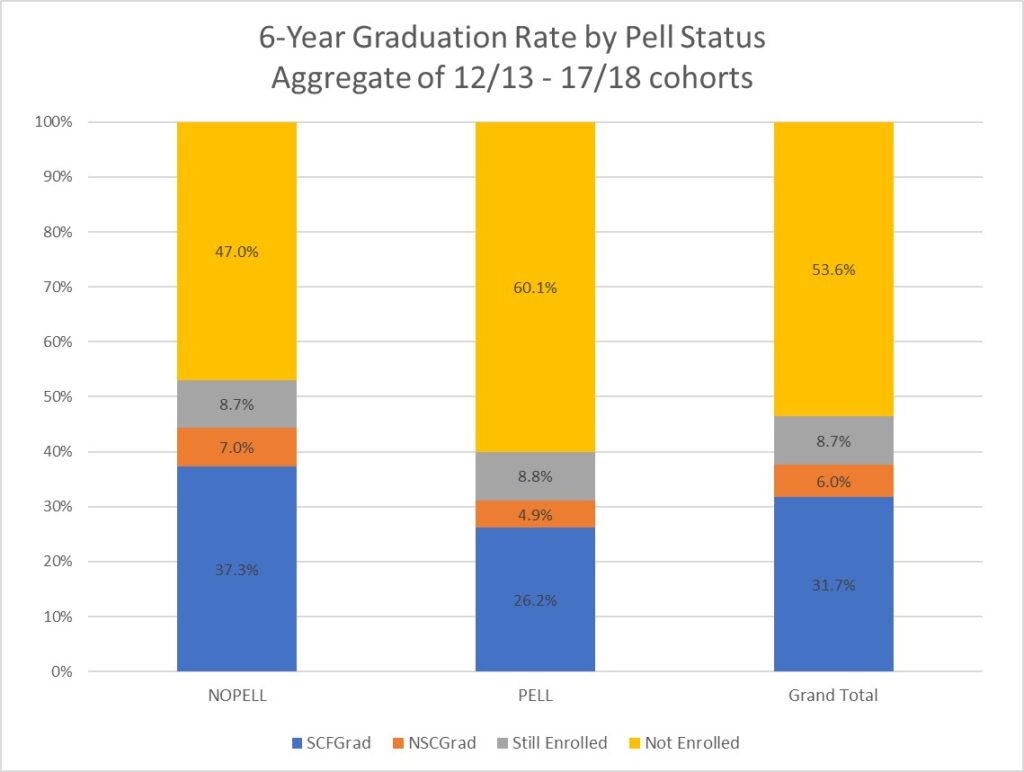
*NSC – SCF Students identified through National Student Clearinghouse.
*NSCGrad – A student that transferred from SCF and graduated from the transfer institution.
Recent Changes
For the 2022-2023 academic year, SCF has changed the graduation rate that is being reported, from an IPEDS graduation rate to a 6-year National Student Clearinghouse Graduation Rate. The graduation rates provided are for the 6-year period ending during the specified year. The information has also been provided by race/ethnicity, gender, and financial aid status.
Please direct questions regarding this information to the Office of Institutional Effectiveness and Research.
